
Your hardware. Your models. One control plane.
LLM Systems Manager is a complete, self-hosted operations platform for LLM infrastructure: monitoring, remote control, tuning, routing, and alerting for llama.cpp, vLLM, and LM Studio, all in one place.
$ bash <(curl -fsSL https://get.llmsysmanager.com/install.sh)
# Debian / Ubuntu
$ curl -fsSLO https://github.com/llmsyscore/llm-systems-manager/releases/download/v1.1.0/llm-systems-manager_1.1.0_all.deb
$ sudo apt install ./llm-systems-manager_1.1.0_all.deb
# RHEL / Fedora
$ curl -fsSLO https://github.com/llmsyscore/llm-systems-manager/releases/download/v1.1.0/llm-systems-manager-1.1.0-1.noarch.rpm
$ sudo dnf install ./llm-systems-manager-1.1.0-1.noarch.rpm
$ curl -fsSLO https://raw.githubusercontent.com/llmsyscore/llm-systems-manager/main/docker-compose.yml
$ curl -fsSL https://raw.githubusercontent.com/llmsyscore/llm-systems-manager/main/.env.example -o .env
$ docker compose up -d
$ brew tap llmsyscore/tap && brew trust llmsyscore/tap
$ brew install llm-systems-manager llm-systems-alarm-engine influxdb@2 influxdb-cli
$ llm-systems-influx-setup
$ brew services start llm-systems-manager
$ brew services start llm-systems-alarm-engine
One command installs the full stack. The installer is interactive. It handles prerequisites, InfluxDB, TLS, and agents, and asks before it starts a service.
Architecture
Three small services, one platform
A lightweight agent on every host, a manager as the control plane, and a standalone alarm engine, with TLS/mTLS on every connection.
agent · per host
One cross-platform binary for Linux and macOS. Auto-detects what each box runs and reports host, GPU, PSU, and inference-server metrics.
- llama.cpp / vLLM / LM Studio
- stable-diffusion.cpp
- GPU · PSU · UPS · cooling
manager · control plane
The dashboard, the OpenAI-compatible gateway, model library and profiles, Autopilot routing, Tower and Forecast, jobs, users and roles, backups.
- web dashboard + admin console
- /v1 inference gateway
- Model Autopilot · Tower · Forecast
alarm engine
Stores every sample, evaluates threshold and anomaly rules, and collapses bursts of related issues into single incidents.
- InfluxDB history
- email · toast · webhook · Discord
- offline buffer + replay
What's inside
Everything self-hosted inference needs, in one place
From a single Mac to a rack of GPU hosts, with the same dashboard, gateway, and alerting.
Tower assistant
An AI assistant you can ask about hosts, models, alerts, energy and runs in plain language, from a drawer on every page. It answers through a model the gateway already serves or a dedicated Tower model, proposes actions as approval prompts, and looks into each new alert for you.
Forecast
Scheduled trend checks over stored history report disk fill, thermal drift, cost creep, slot pressure and more before they become alarms, as a 30-day Outlook or a per-host Briefing. Every finding can raise an alert and offers Ask Tower.
Model Autopilot
Configure which models should be available. Autopilot places them on hardware that can run them, brings them back when a host drops, and automatically scales with the demand.
OpenAI-compatible gateway
One endpoint fronts every backend. A merged model catalog, per-model pinning, pooling, and failover to a live host when one goes down. Streaming included, and apps see one stable URL.
Telemetry & alerting
LLM-aware metrics down to slots, tokens/sec, and KV cache, plus a standalone alarm engine that groups alerts into incidents with a 24-hour severity band, threshold and anomaly rules, and a full metrics viewer.
Energy & cost intelligence
Measures what inference costs in $/Mtok against your electricity price, with savings versus hosted-API pricing, a per-model breakdown of energy and cost, and per-host performance profiles that cut power draw and noise when a system is idle.
Benchmarking & autotuning
A Live benchmark measures the running server through its own API, with pinned baselines re-checked on a schedule. Autotune picks a goal and tunes seven settings, from context and KV-cache type to speculative decoding and slots, on llama.cpp, LM Studio and vLLM.
Model management
Pull models straight from Hugging Face, prune files to reclaim disk, and keep named config profiles per model; switching profiles reloads the model in one click.
Remote control
Start, stop, and hot-swap models from a redesigned library with Compact, List, and Cards views and per-model profiles. Dashboards use a Grid or Flow layout, role presets, compact density, and seven themes.
GPU Report Card
A standardized benchmark that produces one shareable card: time-to-first-token, throughput, tokens/joule, and measured $/Mtok, comparable across providers and machines.
Tools workspace
Report Card, Benchmark, Autotune and Quality guard in one launcher, backed by a fleet-wide run ledger — a run started in one browser is visible in every session, on any device.
Jobs
One scheduler for everything that runs later: tool runs waiting behind a busy host, overnight autotune batches, Tower timers and Forecast runs. Jobs keep running when you close the tab or restart the manager, and show up in Admin › Jobs.
Screenshots
Inside the dashboard
Captured from a live deployment. Every view shown here is part of the product.
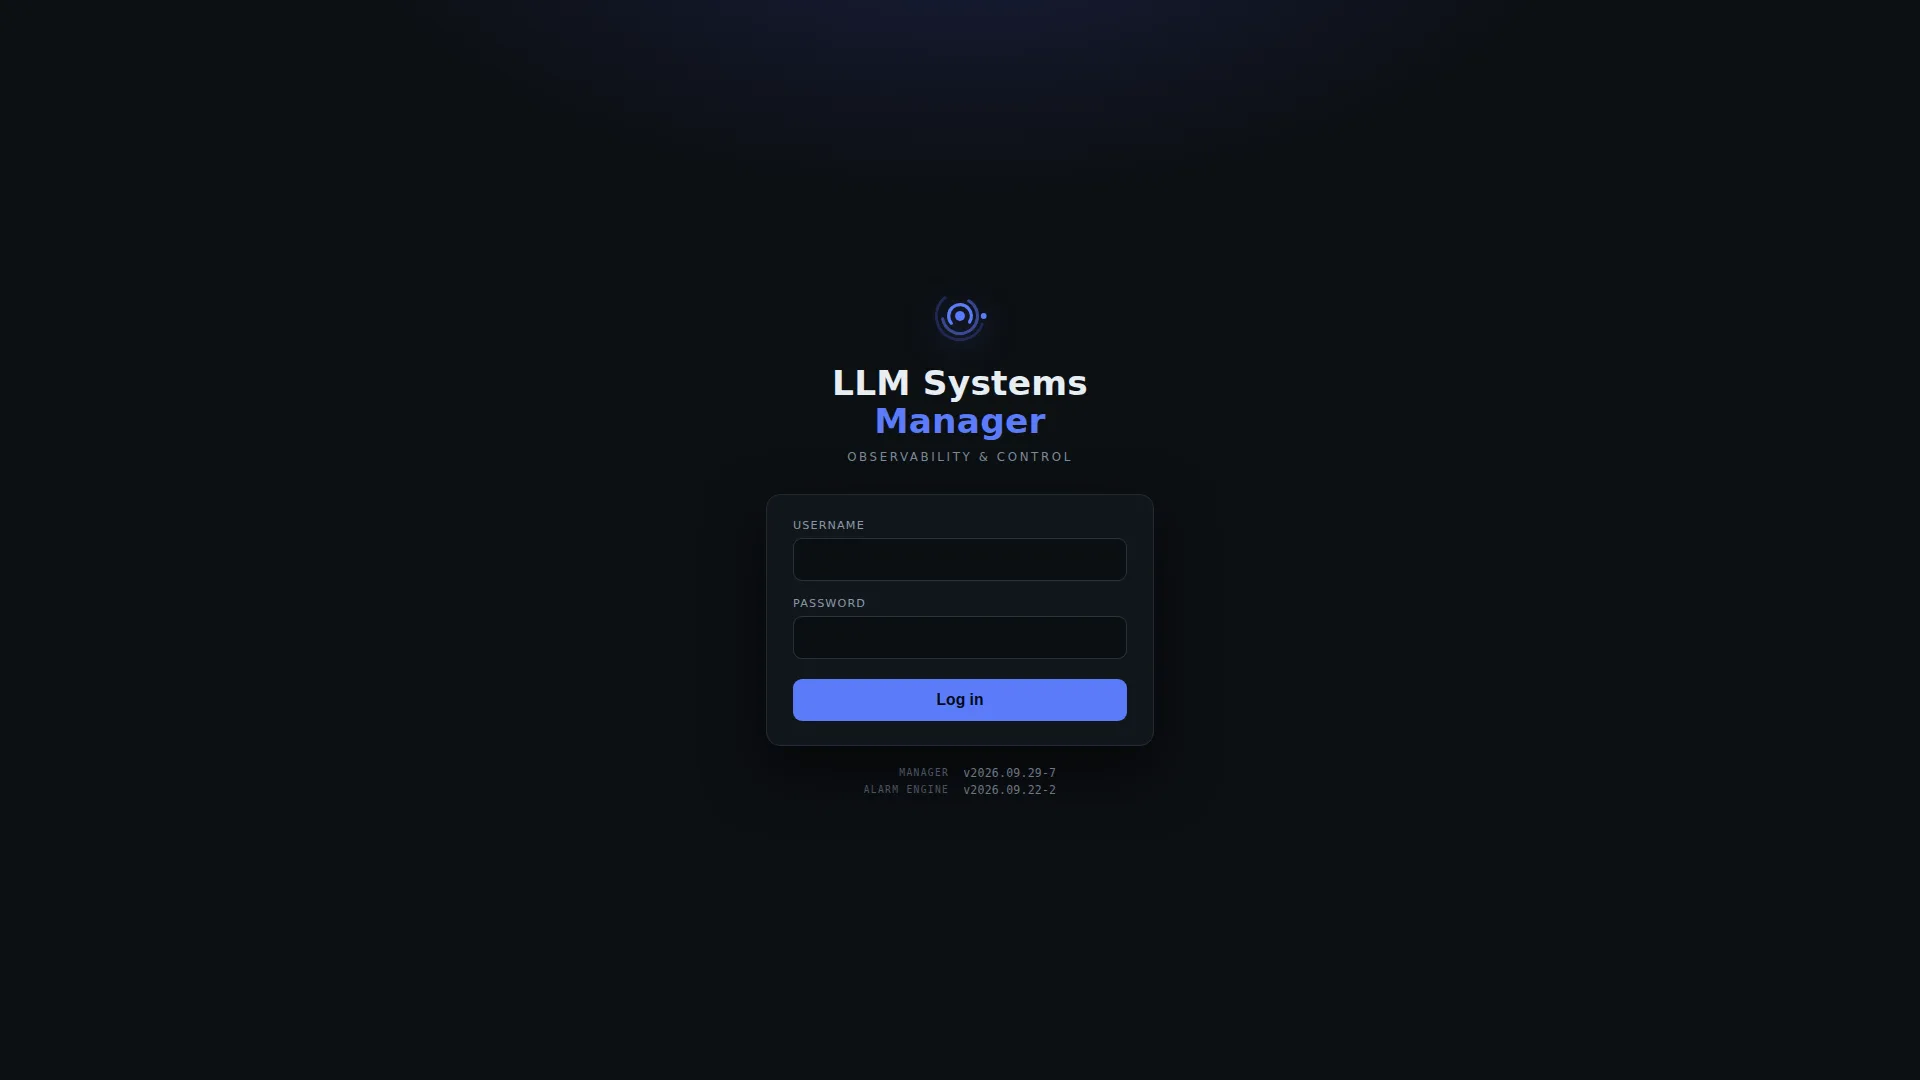
A guided tour through the platform: sign-in, Overall, every dashboard including Forecast, Tower, LLM Control, the Tools launcher with a Live benchmark, chat, image generation, the alarm console, every Admin page including System Health, agent enrollment and Jobs, and the settings drawer.
Installation
Install it your way
The script installer is the preferred path. The alternatives cover specific setups.
Script installer preferred
One interactive command covers everything: full stack, split installs, agents, offline installs, and updates.
Native packages
.deb and .rpm packages for hosts standardized on apt or dnf package management.
Docker Compose
A containerized control plane: manager, alarm engine, and InfluxDB, with agents installed on hosts.
Homebrew
Agents on macOS install straight from the tap, with signed release binaries.
Local hardware. Private data. Full control.
Run models on hardware you own, keep every prompt and metric on your network, and manage it all from one dashboard. Free and open source under AGPL-3.0.